Quantum entropy source on a breadboard

“Only entropy comes easy.” - Anton Pavlovich Chekhov.
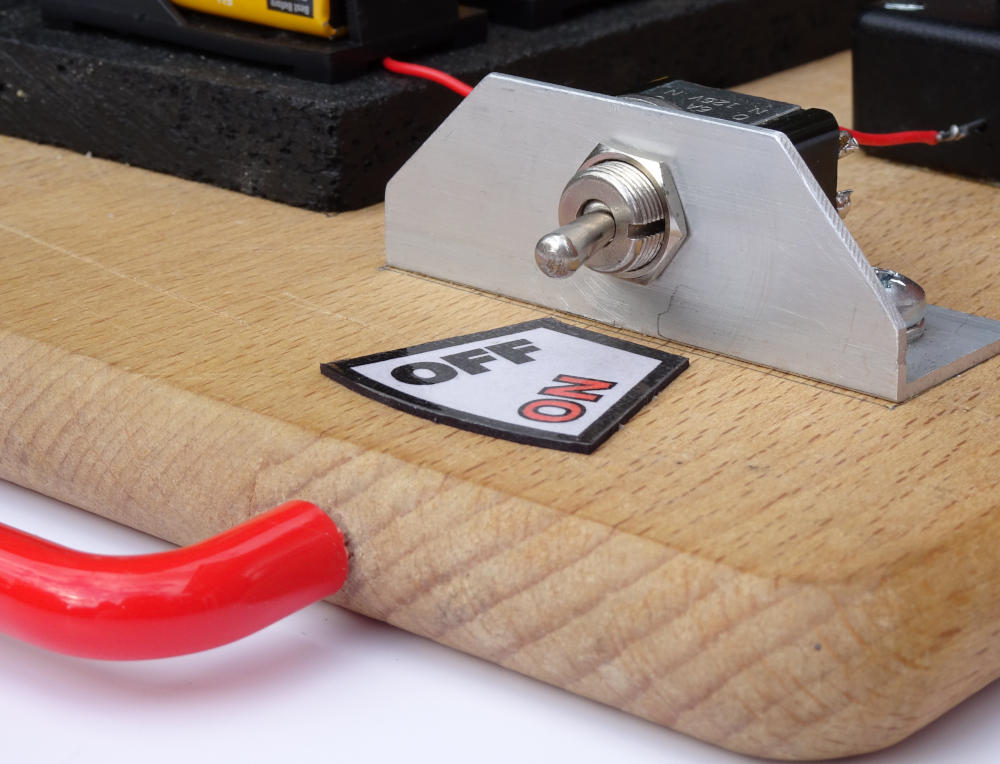
As unequivocal proof of the ease with which you can build a high quality, cryptographic strength entropy source, here is one we built earlier on Granny’s wooden breadboard:-
The making
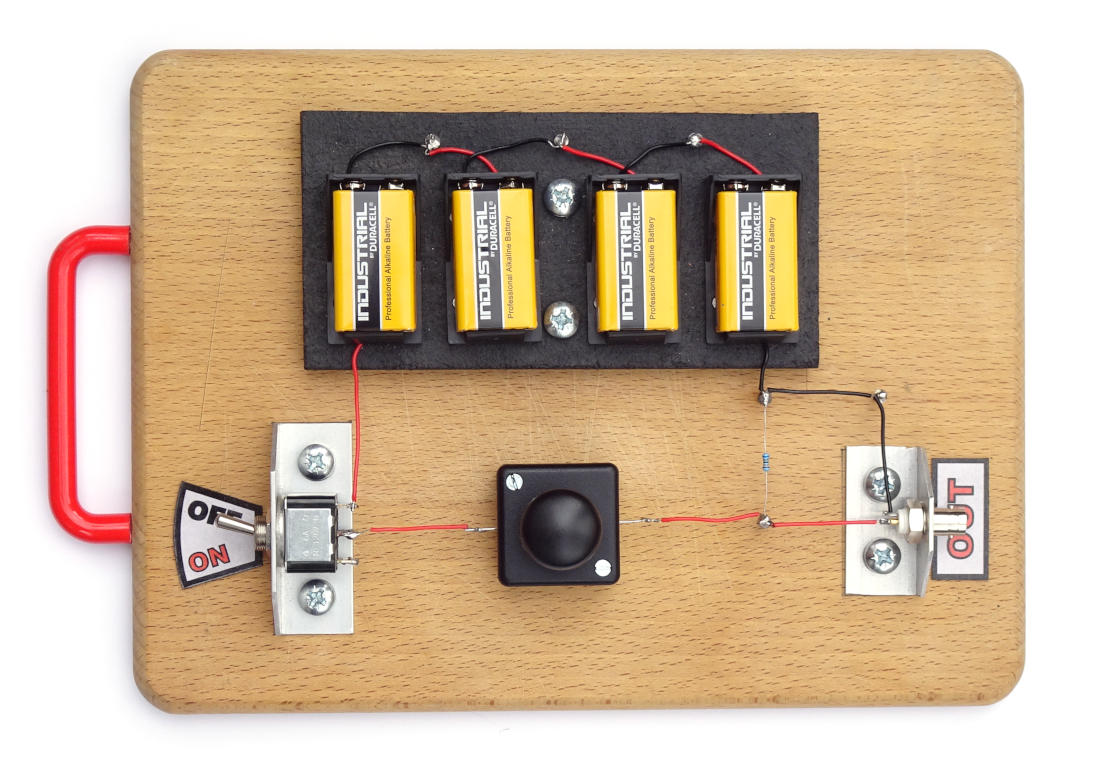
The breadboarded entropy source.
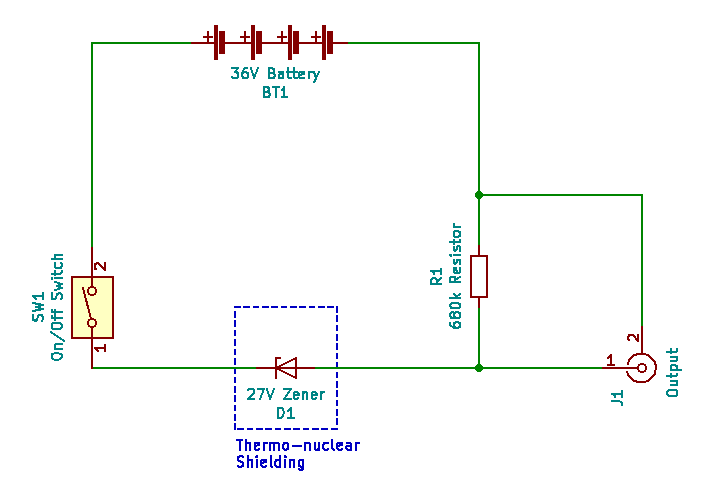
Schematic.
It is a Chekhov circuit, which is the simplest possible entropy generating circuit. So simple in fact that we built it on a wooden board (literally a breadboard). And even used real steel nails. The circuit is named after Anton Chekhov, who said “Only entropy comes easy”. Such wisdom! Essentially, it’s a common BZX 27 volt Zener diode plus 680 kΩ current limiting resistor thus:-
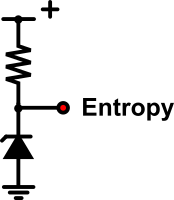
Simplest possible entropy generating circuit, called a Chekhov circuit.
The thermo-nuclear shielding (box made of cryptographic plastic) is necessary to protect the Zener from all light as the junction is within a transparent glass encapsulation. Incident light disrupts the electron avalanche effect and reduces the entropy signal. Nominal reverse current = 18 uA as the battery is actually 39 V. 36 V is only the nominal value of 4 no. 9 V batteries. Frankly, the diode current is somewhat higher, probably nearer 30 uA as we use a direct x1 BNC cable. That’s about 110 trillion electrons tumbling through the junction every second. The combined 1 MΩ scope impedance and limiting resistor parallel out at about 404 kΩ. This resistance acts with the junction capacitance to marginally distort the expected characteristic log normal signal distribution.
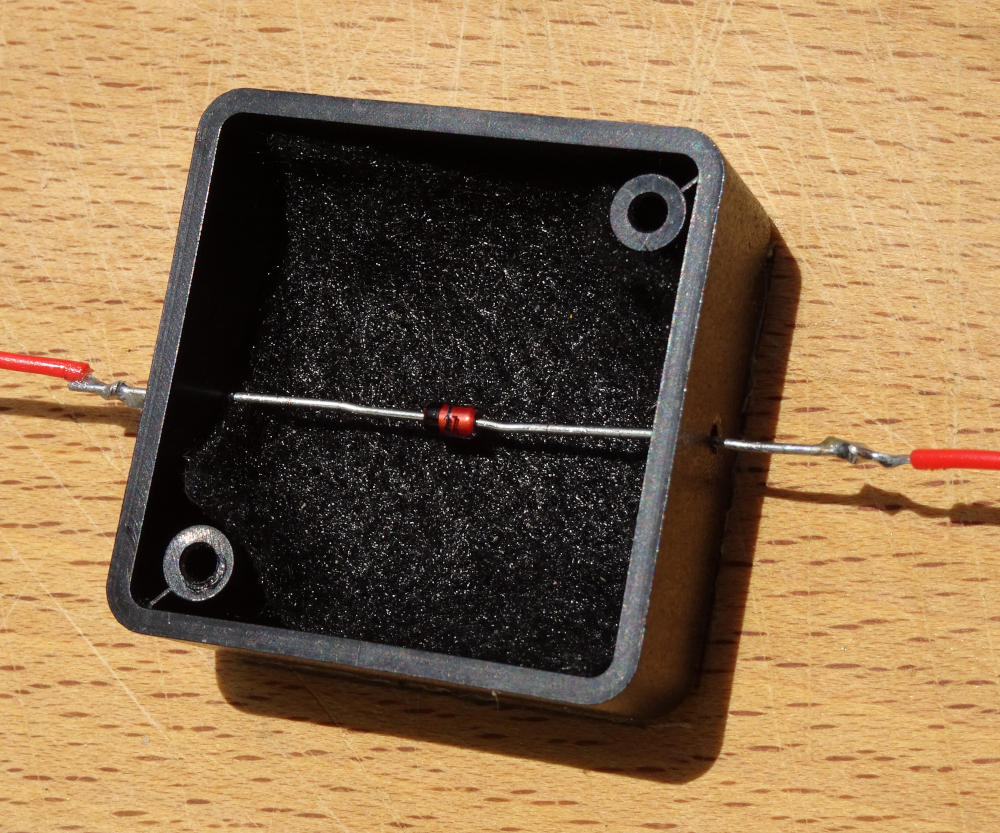
The 27 V Zener diode itself.
It’s a true quantum entropy source for the reasons explained previously in relation to the Avalanche effect within Zener diodes. It really doesn’t have to involve lasers or vacuum point energy to be quantum based. Although stale bread crumbs, dried tomato juice and rotting pieces of salami can have a deleterious effect on circuit impedances and thus entropy rates. Lunches aside, our Chekhov circuit produces a mean unamplified entropy signal of 1.93 Vpp.
The running
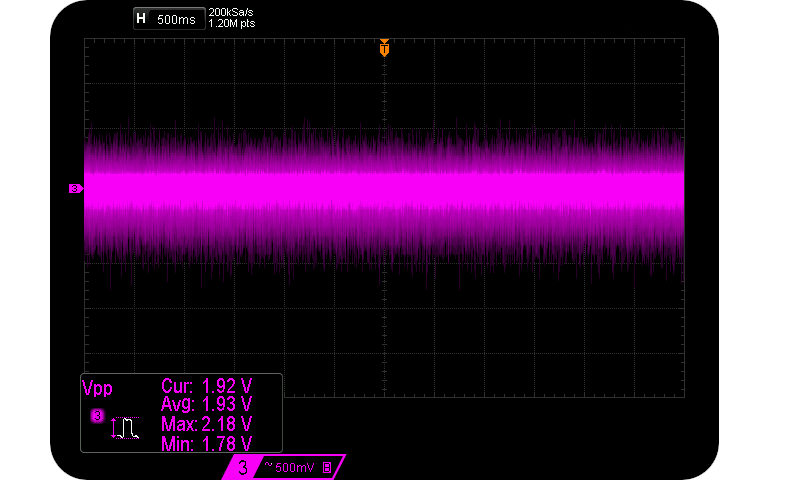
A mean (un-amplified) entropy signal of 1.93 Vpp.
The above approximate 1.9 Vpp signal is readily manipulated by keen individuals, and guaranteed to be caused by the Avalanche effect rather than some unspecified consequence of huge amplifier gain/power supply noise. And readily extracted from.
NIST and at least one popular cryptography forum seem to rigorously promote the diametrically opposite view. There flows an endless tautology about the futility, even impossibility of DIY builds. Why the shtick? The proof is on the chopping board. Just turn it on…
Quantum control.
Then stick the entire thing up an Arduino. Sampling was performed in pairs as $ \text{sample} = x_i - x_{i + 1} + c $ and implemented as: = analogRead(portNo) - analogRead(portNo) + 128 and only use the lower 8 bits of the Arduino’s ADC. The ADC prescaler value was 64 (thus sampling at a theoretical 19 kSa). This decreases sample storage space, and increases the entropy transfer rate off the Arduino. Bear in mind that this is only an entropy source, not a complete TRNG. Thus we are not looking for uniform output distributions at this stage. We’ll take what we can get. We took a 10 MB sample for testing. And what we got is available in the ‘Related files’ section below, including raw samples from an oscilloscope and an Arduino Uno, and some Python3 categorisation and utility scripts.
One of the fundamental paradigms of this site is that you don’t trust no one, and certainly not an obscure REALLYREALLYRANDOM.COM. The raw data is supplied for you to analyse yourselves, and to reach your own independent conclusions. But don’t believe the data either. Build this source, gather your own data and see what you think. Simply treat our data, code and formulae as hypothetical possibilities of what might be in a utopian cryptographic future. Like serving suggestions on tinned food.
The analysis
First impression: Just as in US Supreme Court Justice Stewart’s definition, The Casablanca Test: “I know it (obscenity/pornography) when I see it,” we can tell that the sampled signal contains a good rate of entropy by seeing a visual representation. The following 400 pixel x 400 pixel image is a direct 1:1 greyscale view on the raw sampled data bytes. No recognizable patterns exist at either the micro or macro scales.
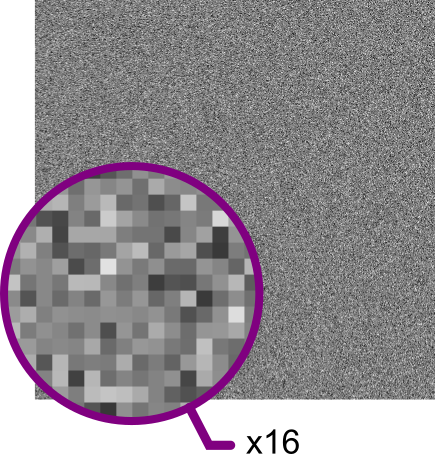
8 bit visual representation (and x16 zoom) of Arduino sampling.
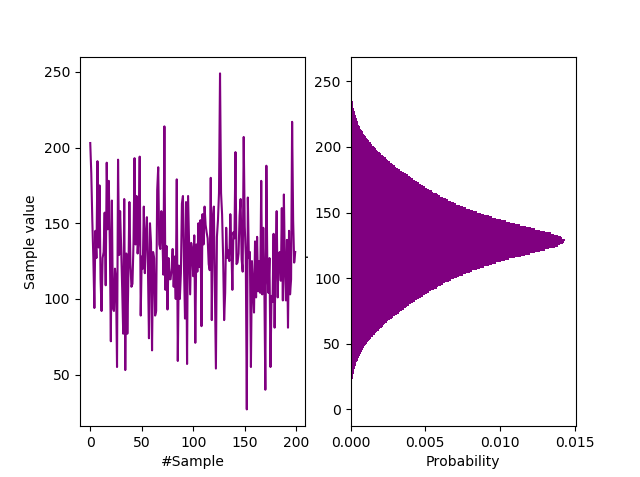
Waveform and probability distribution of Arduino samples.
If you view the signal in the probability domain as above, we see a close similarity to the signal from the Zenerglass, a device built and sampled on similar principles. We characterize the histogram as a shifted bathtub distribution, typical of double samples with an offset $(c=128)$. The offset is simply to prettify the histogram, giving it a central peak. Being constant, it does not contribute to the entropy rate. Sample autocorrelation $(R)$ is less than 0.0008, suggesting that they may be IID. An autocorrelation rule of thumb for IID is a normalised value of $ R<10^{-3} $.
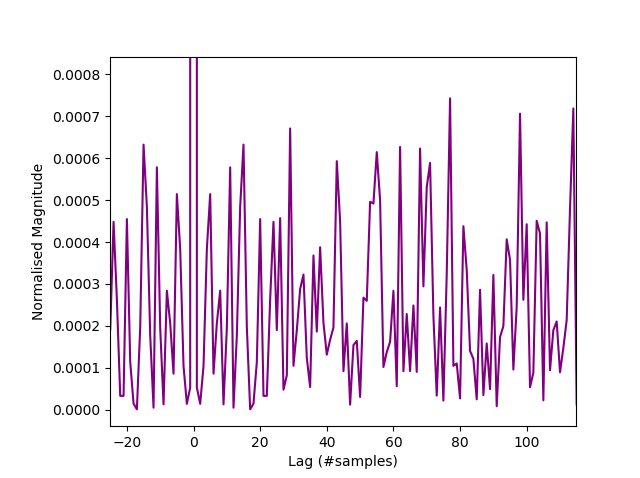
Autocorrelation of Arduino samples.
The Shannon entropy rate for the Photonic Instrument was determined via a compressive approach. Here we use the more common and more conservative min.entropy approach, measuring $H_\infty$. Whilst the former method is sound and easier, much tighter bounds can be placed on the certainty of $H_\infty$. Also the compressive approach does not lead directly to a min.entropy value which is required downstream for randomness extraction calculations using the Left Over Hash lemma. Min.entropy conveniently bypasses much of the guesswork associated with direct compressive methods. From NIST Special Publication (SP) 800-90B, Recommendation for the Entropy Sources Used for Random Bit Generation §5:-
“The IID assumption significantly simplifies the process of entropy estimation. When the IID assumption does not hold, i.e., the samples are either not identically distributed or are not independently distributed (or both), estimating entropy is more difficult and requires different methods.”
NIST uses a common significance level of $\alpha = 0.001$ level. Sample distribution $X$ on $\{0, 1\}^{n}$ over an entropy source $\pi$ has $ H_\infty(X) = - \log_2( P_{max}[X = x] ), x\in \{0, 1\}^{n} $ and NIST considers $H_\infty$ measures for $ n \in \{1, 8\} $. Those values of $n$ represent min.entropy at both the bit and byte levels, and we conservatively take the lowest value.
The two permuted compressions tests (below) are our custom and innovative IID tests. They are safely passed with Pr(17.0 heads and 13.0 tails) = 0.5847 for the fast test, and a pass ranked as > 103/10,000 at $\alpha = 0.01$ for our slow test (a far stronger test):-
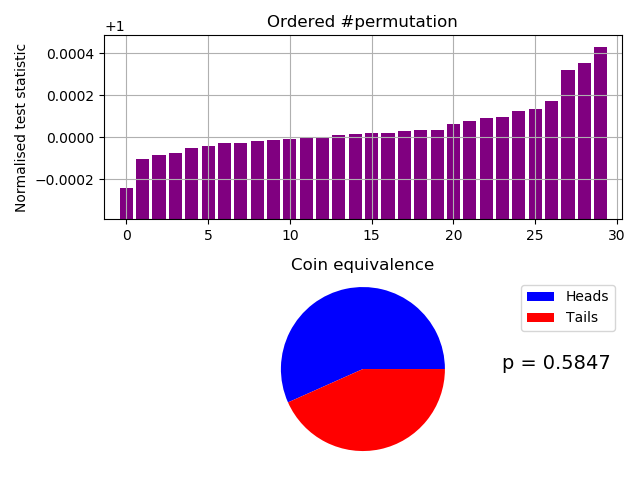
Fast IID permutation test of Arduino samples.
LZMA tests...
Permutation 1 : NTS = 0.9999911954779975
Permu
     ... snip ...
                         000484182633689
Permutation 7 : NTS = 0.9999691828163384
Permutation 8 : NTS = 1.0000440208658905
Permutation 9 : NTS = 1.0000176083463561
Permutation 10 : NTS = 0.9999339486384613
---------------------------------
Broke file into 1,000,000 byte segments.
Tested 10,000,000 bytes for each compressor.
Using 3 compressors.
Minimum NTS = 0.9997568261979243
Maximum NTS = 1.000427730139615
Mean NTS = 1.0000439083895254
0.00% unchanged by shuffle.
Probability of 17.0 heads and 13.0 tails = 0.5847
*** Accept Ho. The data file looks like IID ***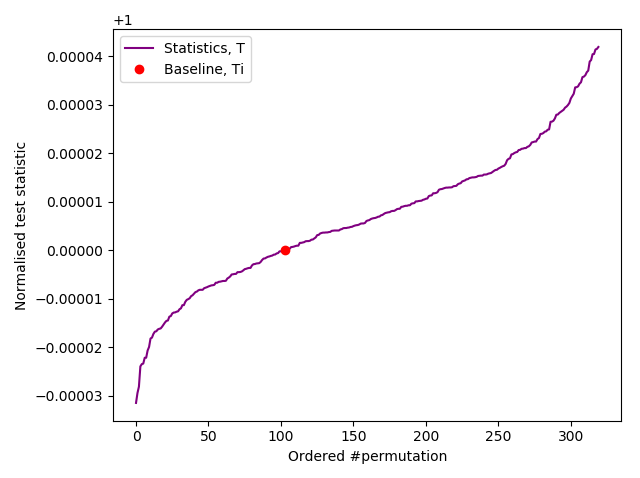
Slow IID permutation test of Arduino samples.
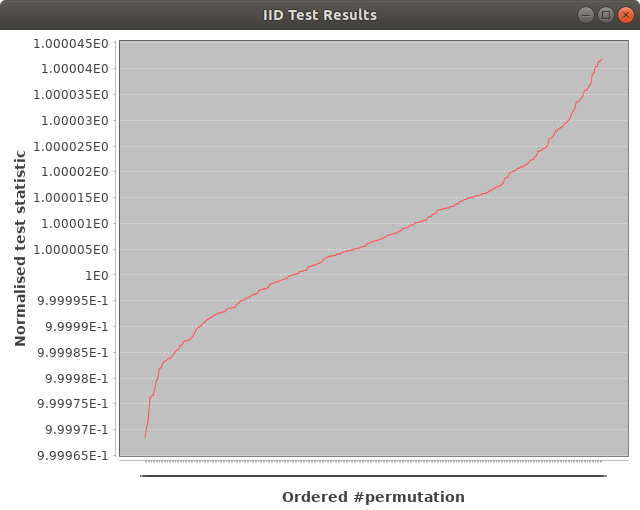
Java based results from slow IID permutation test of Arduino samples.
                   ... snip ...
                           tion 63, Normalised statistic = 1.0000022187311761
Compressor Thread-0 Permutation 63, Normalised statistic = 0.9999685376644711
Compressor Thread-1 Permutation 64, Normalised statistic = 1.0000125849342116
Compressor Thread-0 Permutation 64, Normalised statistic = 1.0000201868164376
Compressor Thread-3 Permutation 64, Normalised statistic = 0.999996362735777
Compressor Thread-2 Permutation 64, Normalised statistic = 0.9999793403392134
Compressor Thread-4 Permutation 64, Normalised statistic = 0.9999971629339061
CURRENT RANK = 103
Remaining running time to full completion = 10007s
Estimated full completion date/time = 2020-01-27T17:58:13.016983

----------------------------------
Ranked as > 103/10,000
*** PASSED permutation test. There is no evidence that the data is not IID ***
Based on 320 permutations.
Test results in file: /tmp/p64-x2.out
Our custom tests are likewise confirmed by the less reliable SP 800-90B IID test:-
$  ./ea_iid -v   /tmp/p64-x2.bin
Opening file: '/tmp/p64-x2.bin'
Loaded 10000000 samples of 256 distinct 8-bit-wide symbols
Number of Binary samples: 80000000
Calculating baseline statistics...
  Raw Mean: 127.997295
  Median: 128.000000
  Binary: false

Literal MCV Estimate: mode = 143753, p-hat = 0.014375300000000001, p_u = 0.014472257486612633
Bitstring MCV Estimate: mode = 40015589, p-hat = 0.5001948625, p_u = 0.50033885572549397
H_original: 6.110566
H_bitstring: 0.999023
min(H_original, 8 X H_bitstring): 6.110566        <=== The min.entropy, (bits/byte).

Chi square independence
  score = 43525.809747
  degrees of freedom = 43410
  p-value = 0.346439

Chi square goodness of fit
  score = 2217.094249
  degrees of freedom = 2295
  p-value = 0.875609

** Passed chi square tests

LiteralLongest Repeated Substring results
  P_col: 0.00849943
  Length of LRS: 6
  Pr(X >= 1): 1
** Passed length of longest repeated substring test

Beginning initial tests...

Initial test results
              excursion: 109483
     numDirectionalRuns: 6.66639e+06
     lenDirectionalRuns: 9
  numIncreasesDecreases: 5.04255e+06
          numRunsMedian: 4.99984e+06
          lenRunsMedian: 24
           avgCollision: 13.4202
           maxCollision: 56
         periodicity(1): 84930
         periodicity(2): 84791
         periodicity(8): 84696
        periodicity(16): 84591
        periodicity(32): 84971
          covariance(1): 1.63832e+11
          covariance(2): 1.63833e+11
          covariance(8): 1.63836e+11
         covariance(16): 1.6383e+11
         covariance(32): 1.63829e+11
            compression: 9.56302e+06

Beginning permutation tests... these may take some time
Permutation Test (core 0): 0 tests passed
Permutation Test (core 3): 0 te
                    ... snip ...
                    re 0): 18 tests passed
Permutation Test (core 2): 18 tests passed
Permutation Test (core 5): 18 tests passed
Permutation Test (core 3): 18 tests passed
Permutation Test (core 4): 18 tests passed
Permutation Test (core 1): 18 tests passed


                statistic  C[i][0]  C[i][1]  C[i][2]
----------------------------------------------------
                excursion       6       0       6
       numDirectionalRuns       6       0      12
       lenDirectionalRuns       5       6       0
    numIncreasesDecreases       6       0       7
            numRunsMedian       6       0      26
            lenRunsMedian       5       1       9
             avgCollision       6       0       6
             maxCollision       9       1       5
           periodicity(1)       6       0       6
           periodicity(2)      29       0       6
           periodicity(8)      41       0       6
          periodicity(16)      33       0       6
          periodicity(32)       6       0       6
            covariance(1)       6       0       6
            covariance(2)       6       0       7
            covariance(8)       6       0      26
           covariance(16)      21       0       6
           covariance(32)      36       0       6
              compression      85       0       6
(* denotes failed test)

** Passed IID permutation tests
Based on triple confirmation of the data appearing as IID, we can say that the native $H_\infty$ of this breadboard source is 6.11 bits/byte (double sample). That’s a raw internal Arduino Uno entropy generation rate of ~55 kbits/s (8.95 kSa/s effective single sample rate).
The conclusion
Randomness extraction and off loading samples from the Arduino board will of course lower this figure considerably. So what can we do with this[1]?
| Cryptographic objective | Metric |
|---|---|
| Our bang for buck | 40 bits/s/g |
| We create a single 128 bit key/IV | < 0.01 s |
| We rotate 256 bit keys | 53/s |
| We fill 100 larger sized Tweets | 12 s |
| We create a 1MB one time pad | 10 min. |
| versus | |
| Speed of Fourmilab’s HotBits | 800 bits/s |
| Speed of NIST’s Randomness Beacon | 8.5 bits/s |
| Speed of Arduino Entropy Library | 64 bits/s |
All that’s necessary is a Zener diode, resistor, batteries and a working hammer. Not too shoddy .
Notes.
[1] For the above comparisons table, we have assumed an $n \over m$ ratio of 2 across a generic $\text{Ext}: \{0,1\}^n \to \{0,1\}^m$ randomness extractor, followed by a further factor of safety of 2. Therefore final on-board cryptographic TRNG rate = 13,700 b/s.
[2] Interestingly though, had we taken the compressive approach $H_\infty$ would have been estimated as 3.58 bits/byte if we use a safety factor of 2. The above min.entropy approach results in a very comparable 3.06 bits/byte with the same safety factor. So a fundamental question arises over which approach is more correct /less worse: What are the cryptographic and entropic benefits of a safety factor being exactly 2.0? Especially since there are no references to entropy safety factors within the literature…
The following binary data files (.bin) can be plotted with Gnuplot as plot 'scope-dump_50ksa.bin' binary format="%uint8" using 1 with lines.