Our own tests
In probability theory and statistics, a collection of random variables is independent and identically distributed if each random variable has the same probability distribution as the others, and all are mutually independent. What happened in the past has no effect on the future.
The IID assumption is often made for datasets where all samples stem from the same generative process and that the generative process is assumed to have no memory of past generated samples. Thus the order the samples are taken in is irrelevant and has no impact. This is important, as it can be tested empirically by permutation. By randomly shuffling /permuting the original samples, we can make up as many data sets as we like and perform myriad statistical tests on them.
Permutation testing is a way to test a statistical hypothesis in which the actual value of the test statistic is compared to a reference distribution that is inferred from the input data, rather than a standard statistical distribution. The general approach of NIST permutation testing is to generate 10,000 permutations of the dataset, computing various test statistics for each permutation and comparing the result with a test statistic computed on the original dataset. The process is explained below:-
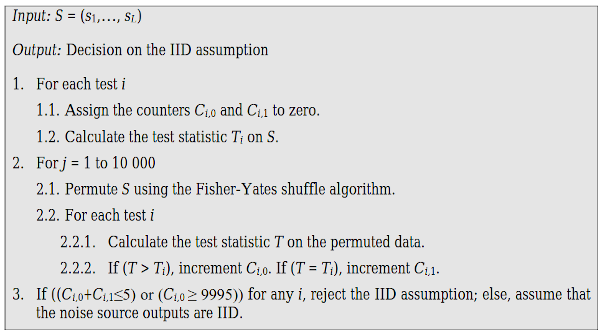
Generic Structure for NIST Permutation Testing.
Ordered and plotted on a chart, a test statistics curve might look like:-
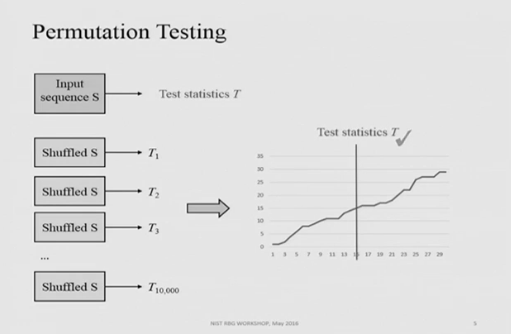
Ordered test results from NIST Random Bit Generation Workshop 2016 (https://www.nist.gov/news-events/events/2016/05/random-bit-generation-workshop-2016).
If $T$ is ranked somewhere within the middle of the ordered and charted set $T_i$, it suggests that the data is IID. This forms the basis of such tests’ null hypotheses ($H_0$), our slow permutation test, and NISTs own IID test. We also have a fast IID test working on a slightly different basis.
If the samples are IID, permuting the dataset is not expected to change the value of the test statistics significantly. In particular, the original dataset and permuted datasets are expected to be drawn from the same distribution; therefore, their test statistics should be similar. Unusually high or low test statistics are expected to occur infrequently. However, if the samples are not IID, then the original and permuted test statistics may be significantly different.
The counters $C_{i,0}$ and $C_{i,1}$ are used to find the ranking of the original test statistics among the permuted test statistics (i.e., where a statistic for the original dataset fits within an ordered list of the permuted datasets). Extreme values for the counters suggest that the data samples are not IID. If the sum of $C_{i,0}$ and $C_{i,1}$ is less than 5, it means that the original test statistic has a very high rank; conversely, if $C_{i,0}$ is greater than 9995, it means that the original test statistics has a very low rank. The cut-off values for $C_{i,0}$ and $C_{i,1}$ are calculated using a type I error probability (α) of 0.001. See Note 3 below.
The tests listed below are NIST’s attempts to check the validity of the IID assumption. Some of the tests (e.g., the compression test) are effective at detecting repeated patterns of particular values (for example, strings of sample values that occur more often than would be expected by chance if the samples were IID), whereas some of the other tests (e.g., the number of directional runs test and the runs based on the median test) focus on the association between the numeric values of the successive samples in order to find an indication of a trend or some other relation, such as high sample values that are usually followed by low sample values.
- Excursion Test Statistic
- Number of Directional Runs
- Length of Directional Runs
- Number of Increases and Decreases
- Number of Runs Based on the Median
- Length of Runs Based on Median
- Average Collision Test Statistic
- Maximum Collision Test Statistic
- Periodicity Test Statistic
- Covariance Test Statistic
- Compression Test Statistic
- 5 Additional Chi-square Statistical Tests (Independence for Non-Binary Data, Goodness-of-fit for Non-Binary Data, Independence for Binary Data, Testing Goodness-of-fit for Binary Data, Length of the Longest Repeated Substring Test)
And some also require sample format conversions. Meh. This seems awfully complicated and quite bothersome. Plus our testing shows no advantage for the NIST tests over ours. All behave similarly. However, the REALLYREALLYRANDOM tests have the unequivocal advantage of simplicity and transparency. Plus, there are concerns regarding the interpretation of the reference distribution for at least the NIST compression test. We need to be sure that the NIST coded implementation works properly, and having alternatives to NIST is in everyone’s security interest. Indeed, it’s the quintessential scientific method of reproducible results from multiple independent trials used to verifying a hypothesis. Hence our own independent IID tests.
We now have three tests in our toolbox to help us verify that a sample is IID, and thus measure $ H_{\infty} $ accurately to determine your source’s entropy rate (for your particular $ \epsilon, \tau $ sampling methodology).
Slow permutation test
Our slow test is founded upon the concept that general purpose, well tested compression algorithms exploit correlation to create smaller archives. More correlation = more smaller. Less correlation = more bigger. Easy and transparent. Rather than hypothetical distributions of co-variate median-collision gubbins, our test statistic, T on sample S = |Bzip2(S)| + |Gzip(S)| + |XZ(S)| + |LZMA(S)| which we implement like this:-
Input: S = (S1, ..., SL).

Output: Decision on the IID assumption.

1. Assign the counter C to zero.
2. Calculate the test statistic Ti on S.
3. For j = 1 to 10,000
   3.1. Permute S using the Fisher-Yates shuffle algorithm.
   3.2. Calculate the test statistic T on the permuted data.
   3.3. If (T < Ti), increment C.
4. If (C < 100), reject the IID assumption; else, assume that the noise source outputs are IID.
and can be represented as:-

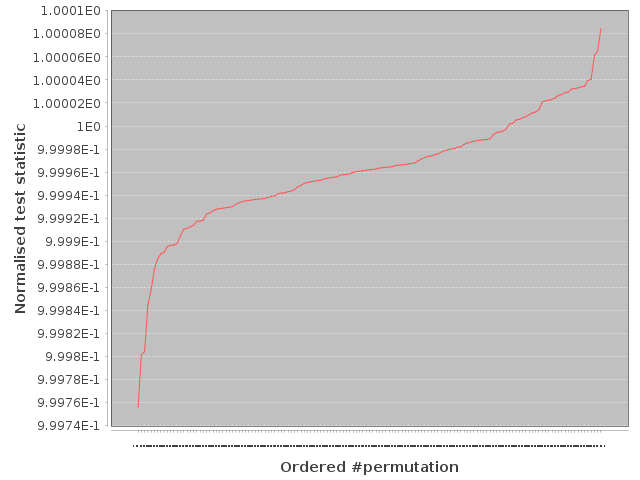
Ordered ranking of 10,000 normalised test statistics wrt probability distributions.
We use Bzip2, Gzip, XZ and LZMA compression algorithms to calculate the normalised test statistic. All four are mature and globally recognised. So our test statistic is:-
$$ \text{NTS} \ = \frac{|\text{Compressed permuted sample}|}{|\text{Compressed initial sample}|} \ = \frac{T}{T_i} $$
We borrow from NIST in performing the 10,000 permutations of sample data S. However this is not as slow as it may sound. The test is coded in Java and multi-threaded, utilising $(n-1)$ cores of any $n$ cored CPU. But most importantly, it is easy to develop a feel for how the test is going due to live test statistics output. Simply put, if the normalised test statistics are looking unfavourable for the current sampling methodology, chuck it away. Just amend the $(\epsilon, \tau)$ sampling methodology. Increase the sampling resolution ($\downarrow \epsilon$), drop sample bits $(\downarrow N_{\epsilon} )$ or increase the sample interval ($\uparrow \tau$). Decimating the samples is an equivalent alternative to increasing the sample interval.
In light of this, we have opted to increase the strength of our slow test ten fold compared to that of NIST’s test. We have adopted significance level α = 0.01. We have also adopted a one sided test, rather than two sided as NIST does. A two sided test is not appropriate for compressive testing alone. Even if all 10,000 permuted compression statistics ($T$) are smaller than the original ($T_i$), that is no reason to reject $H_0$ as what could the alternative hypothesis possibly be? Thus we might better consider $C > 10$ as a one sided test, but we chose to increase the test significance to require $C > 100$ before accepting $H_0$. This increases the strength of the test, although at the increased risk of Type 1 errors. We accept this risk because as $T$ values are collated in real time, it is unnecessary to complete all of the 10,000 permutations if $C > 100$ is clearly going to be achieved earlier. If a test is going badly, change the sampling. So,
NIST IID test:-
If ((Ci,0 + Ci,1 ≤ 5) or ( Ci,0 ≥ 9995)) for any i, reject the IID assumption; else, assume that the noise source outputs are IID.RRR slow IID test:-
If C < 100, reject the IID assumption; else, assume that the noise source outputs are IID.The inbuilt charting looks like:-
Successful test of a synthetic, known to be IID, entropy source.
The initial baseline statistic 1E0 value must be withing the range (> 100 points past the start) of the curve for a successful test. The test output results can also be charted like (using our java-iid-display.py program):-
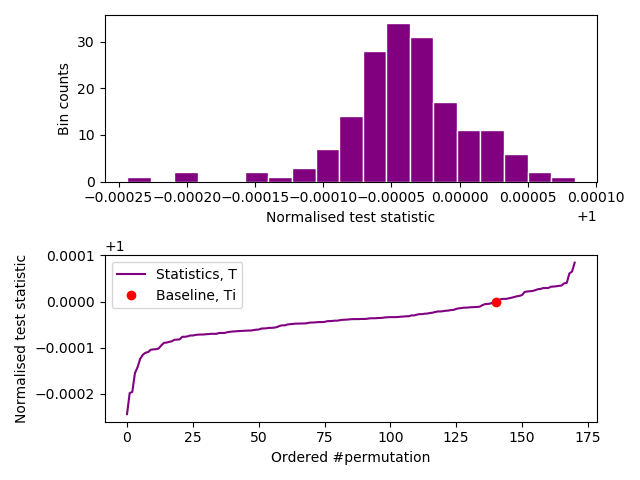
Successful test of a synthetic, known to be IID, entropy source.
In this case, the initial baseline statistic (red dot) has to be adjacent to the ‘S’ curve after permutation #100. The spread of the normalised test statistics is apparent from the histogram above the ‘S’ curve.
Fast permutation test
This test is based on the fact that a fair coin lands evenly heads up or tails up. Again, very simple. We actually check to see if the expectation $ E(X_i = H, X_i = T ) = \frac{1}{2} $ as part of a Bernoulli process. The thinking goes:-
Inputs: S = (S1, ..., SL).

Output: Decision on the IID assumption.

1 Break the entire sample file (S) into 10 sequential parts, (S’1, …, S’10).
2. Assign the counters H and T to zero.
3. For each compression algorithm
   3.1. For j = 1 to 10
      3.1.1. Calculate the test statistic Ti on S’j.
      3.1.2. Permute S’j using the Fisher-Yates shuffle algorithm.
      3.1.3. Calculate the test statistic T on the permuted data.
      3.1.4. If (T < Ti), increment T.
      3.1.5. If (T > Ti), increment H
      3.1.6. If (T = Ti), increment both T and H by 0.5.
4. Calculate p based on Binomial test for distribution B(N = 30, p = 0.5).
5. If (p < 0.05), reject the IID assumption; else, assume that the noise source output is IID.
This works because our $H_0$ = IID. Take a sequence and compress it to give a length test statistic $T_i$. Permute the sequence and re-compress to give a length test statistic $T$. It is entirely random whether $T > T_i$ or $T < T_i$ if $H_0$ is true. This is stochastically equivalent to tossing a fair coin, and counting the numbers of heads and tails with the long run expectation of a 50/50 split. Note: There is a literal but infrequent ‘edge’ case where $T = T_i$, and we mitigate this by incrementing both heads and tails counts by 0.5. We use bz2, zlib and lzma Python algorithms for this fast test. But now see the update below.
A one tailed Binomial test can then exactly calculate the probability of exceeding our head count with $H_0$ being true. We thus could calculate:-
$$ p = \sum_{i=H}^{30} {{30}\choose{i}} \Big( \frac{1}{2} \Big)^i \Big( \frac{1}{2} \Big)^{30-i} $$
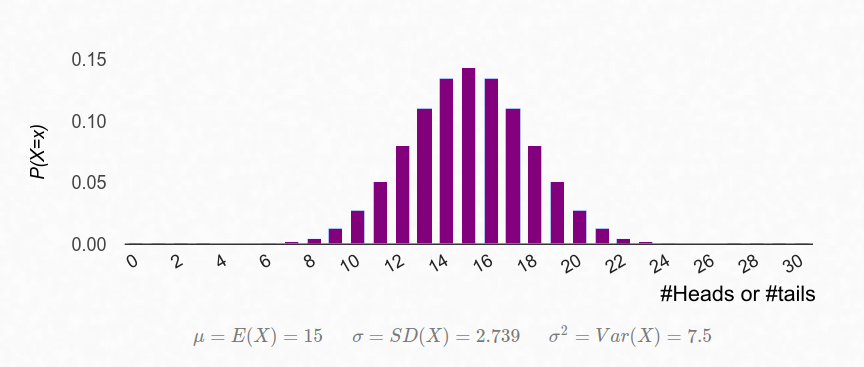
The Binomial distribution for 30 fair coin tosses (coin equivalence).
30 trials are more than adequate to accept/reject $H_0$ as $Pr(H = 30, T = 0)$ for a Binomial distribution $\mathcal{B}(n = 30, p = 0.5) = 9.31 \times 10^{-10} \ll 0.05$. NIST uses a probability of 0.001, but our tests are stronger.
When passed, the test output results chart like:-
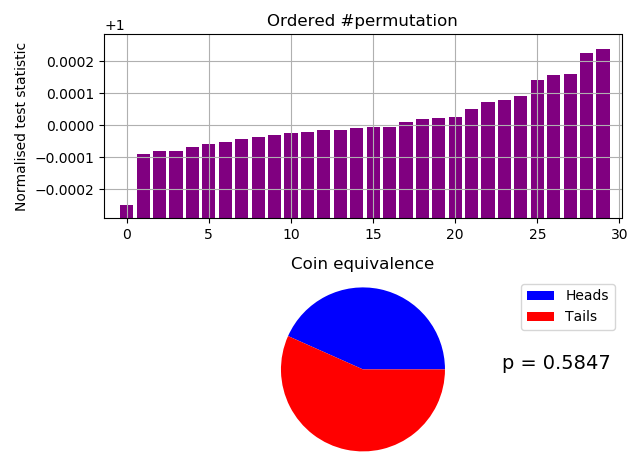
Successful test (p > 0.05) of a synthetic, known to be IID, entropy source.
Notice a rough approximation to the curved output (CDF like) from our slow IID test. We find that a 10 MB sample file is appropriate as it would be broken into 10 number 1 MB chunks, which fits well with a scan window of up to 900 kB for some compression implementations. NIST 800-90b, §3.1.1 Data Collection only requires (at the lowest) 1,000,000 bits (or 125,000 bytes after type I /II format conversions).
Update
The fast permutation test has been revised to only include the bz2 compression algorithm. So now there are only 10 tests which all use the same compressor. Don’t worry, $H_0$ as $Pr(H = 10, T = 0)$ for a Binomial distribution $\mathcal{B}(n = 10, p = 0.5) = 0.00195 \ll 0.05$ still.
Notes:-
-
Large portions of this page are taken verbatim from NIST Special Publication 800-90b, Recommendation for the Entropy Sources Used for Random Bit Generation §5.
-
The ordering diagram above has T and Ti the other way around from 800’s Fig.4 algorithm. So either way, there is an issue of consistency with the inequality sign in Fig.4 point 2.2.2.
-
There is another (inexplicable) counter in the NIST implementation from the GitHub repository located at https://github.com/usnistgov/SP800-90B_EntropyAssessment. $C_{i,2}$ is not mentioned anywhere in the 90b documentation. We don’t know what it represents, and what it’s implication might be for the validity of the test suite.