NIST SP 800-90B tests
BLUF:-

But see our review of the latest version of this suite.
The NIST SP 800-90B non IID tests+ only apply (and only when they’re behaving) to uniformly distributed data sets. The kind that you hardly ever get sampling real world, physical entropy sources. And the less uniformly distributed the data is, the less they apply. So they don’t really apply at all. Use our compression method instead to measure real entropy. Or adjust your $(\epsilon, \tau)$ sampling methodology to eliminate autocorrelation and proceed as for IID data.
+As implemented in the GitHub repository located at https://github.com/usnistgov/SP800-90B_EntropyAssessment. We haven’t delved too deeply into the underlying maths bit ourselves. Others have though and the same conclusions emerged. In the spirit of openness, we have published all our data below.
John Kelsey, Kerry A. McKay and Meltem Sönmez Turan, Predictive Models for Min-Entropy Estimation, and Joseph D. Hart, Yuta Terashima, Atsushi Uchida, Gerald B. Baumgartner, Thomas E. Murphy and Rajarshi Roy, Recommendations and illustrations for the evaluation of photonic random number generators both concluded that the tests are pants, to use the cryptographic parlance.
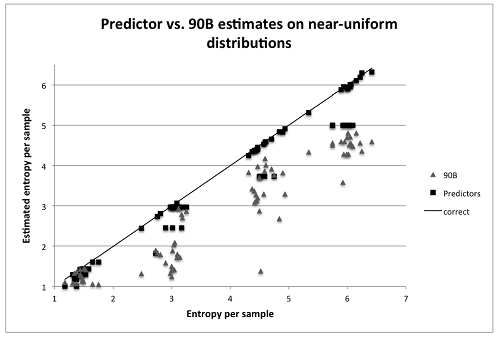
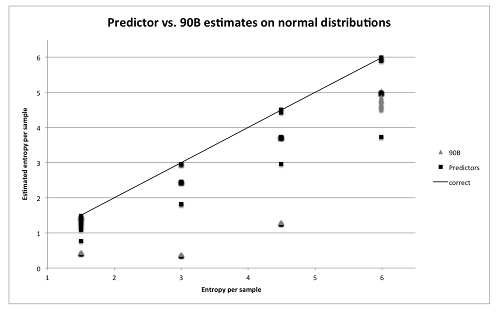
Kelsey, McKay and Turan have plotted what they term the 90B tests against synthetic files with predetermined entropy in near uniformly and normally distributed situations. The following comparisons were obtained, with the $\blacktriangle$ symbols representing the 90B tests:-
Somewhat paraphraseologically(?):-
“NIST recommendations allow some post-processing before the entropy analysis, but deterministic algorithms cannot increase the entropy rate and serve only to make the entropy estimation process more difficult. Indeed, this has been shown for the commonly used post-processing technique of least significant bit extraction. It is known that some of the tests in the NIST suite severely underestimate the min-entropy of entropy sources with normal distributions. This is a real problem because many physical entropy sources have normal or approximately normal probability distributions. Thus, the NIST test suite unintentionally encourages designers of these systems to include post-processing before testing, since this is the only way their source can receive a high entropy estimate from the NIST suite.”
“Near-uniform distributions are particularly interesting because the majority of the 90B estimators try to fit the data to a distribution in that family. Thus, one would expect the 90B estimators to work quite well. However, the plots show that this is not always the case – there are several points where the 90B methods give massive underestimates.”
“On the other hand, some predictors such as LZ78Y provided impossible results of over 11 bits of entropy per sample. This indicates that the models constructed by such predictors are not good fits for these bytes sequences.”
We have similarly encountered other such wild entropy measures (such as 21 bits/byte) in our own simulations. We appreciate that entropy estimation is a very challenging problem when the distribution of the dataset is unknown and the IID assumption cannot be made. However, it seems incredulous that an assessment methodology promoted by a body as erstwhile as NIST should be so inapplicable to real world entropy sources. (Insert obligatory conspiracy theory 😈)
We’re omitting the Shuangyi Zhu, Yuan Ma, Tianyu Chen, Jingqiang Lin and Jiwu Jing Analysis and Improvement of Entropy Estimators in NIST SP 800-90B for Non-IID Entropy Sources paper as they use a Markov model for simulation data which seems inappropriate to a critique of said model. However, they effectively reach the same conclusions (just less so).
Our testing follows.
Uniform, non-IID
To form a basis for comparison, we synthesised the following non-IID file with a simple correlation:-
import random

d = ['abcd', 'efgh', 'ijkl', 'mnop', 'qrst']

with open('/tmp/niid.words', 'w') as f:
    for i in range(260000):
        word = random.choice(d)
        f.write(word)
Which leads to the following output from running the NIST 90B tests on this dataset:-
Entropic statistic estimates:
Most Common Value Estimate = 4.30121
Collision Test Estimate = 2.57572
Markov Test Estimate = 0.590112
Compression Test Estimate = 0.767195
t-Tuple Test Estimate = 0.656856
Longest Reapeated(sic) Substring Test Estimate = 0.641143

Predictor estimates:
Multi Most Common in Window (MultiMCW) Test: 100% complete
	Correct: 0
	P_avg (global): 0
	P_run (local): 4.76837e-07
Multi Most Common in Window (Multi MCW) Test = 21
Lag Test: 100% complete
	Correct: 198710
	P_avg (global): 0.199738
	P_run (local): 0.544434
Lag Prediction Test = 0.877172
MultiMMC Test: 100% complete
	Correct: 42100
	P_avg (global): 0.0426174
	P_run (local): 0.000100136
Multi Markov Model with Counting (MultiMMC) Prediction Test = 4.55241
LZ78Y Test: 99% complete
	Correct: 704656
	P_avg (global): 0.705843
	P_run (local): 0.567383
LZ78Y Prediction Test = 0.50258    <====
Min Entropy: 0.50258
A min. entropy of 0.50258 bits/byte seems close to the theoretical value of 0.58048 bits/byte based on the most frequent occurrence of groups of 4 characters. Shannon entropy via cmix compression is 0.58255 bits/byte whilst the theoretical Shannon entropy = 0.58110 bits/byte. It then seems that in the initial case of uniformly distributed non-IID data, the 90B tests produce entropy measures comparable with alternative methods. So far, so good if we ignore that 21 Multi MCW reading…
But…
The $H_{\infty} = 0.50258$ comes from here:-
LZ78Y Prediction Test = 0.50258and from the horse’s mouth:-
“The LZ78Y predictor is loosely based on LZ78 encoding with Bernstein’s Yabba scheme [Sal07] for adding strings to the dictionary.” - NIST 800-90b §6.3.10.
LZ78 is a compression algorithm! NIST has simply modified it to measure min.entropy rather than Shannon entropy.
Near uniform, non-IID
We now look at other, more realistic distributions of non-IID data such as a bit fixing source might generate (such as camera JPEGs). A synthetic file with near uniformly distributed entropy was constructed as:-
543394672338654489241727832251630595849012369539256446919966-fixed-text
043879463663886904088001594305988717988528785835264959701463-fixed-text
923509952616900740198769908244018336391467850544005481023141-fixed-text
920844576644976142249204992716223401194333438114010342577840-fixed-text
93613389247763086796855055127...
from these parts:
- 60 fully random 0 – 9 digits (Mersenne Twister – but assume TRNG via computational indistinguishability.)
- 11 fixed digits saying exactly “-fixed-text”.
- 1 fixed carriage return.
- Overall length = 15,000 lines or 1,080,000 bytes.
$\log_2(0 – 9 ~digits)$ implies 3.32193 bits /character for the random digits.
The theoretical Shannon entropy, only considering the 60 random digits per line = 3.32193 * 60 * 15000 /8 = 373,717 bytes.
The probability distribution of the test file is:-
Value Char Occurrences Fraction
 10   ←        15000   0.013889
 45   -        30000   0.027778
 48   0        89751   0.083103
 49   1        89804   0.083152
 50   2        90337   0.083645
 51   3        89689   0.083045
 52   4        89838   0.083183
 53   5        89329   0.082712
 54   6        90901   0.084168
 55   7        90211   0.083529
 56   8        89566   0.082931
 57   9        90574   0.083865
100   d        15000   0.013889
101   e        30000   0.027778
102   f        15000   0.013889
105   i        15000   0.013889
116   t        30000   0.027778
120   x        30000   0.027778
From which we can calculate a 0 order (no lag) min. entropy of $\log_2(Pr(X = 6)) = 3.570584$ bits/byte. We now use the cmix compressor to compress the test file, resulting in a file size of 374,094 bytes. The theoretical minimum size = 373,717 bytes based on Shannon entropy. cmix compression results in a file that is only 0.1% higher.
And thus we arrive at the empirically measured entropy rate of 2.77107 bits/byte. This compares favourably with the exact theoretical entropy rate of 2.76827 bits /byte, again approximately within 0.1%.
And now running the 90B tests with 7 active bits, :-
Entropic statistic estimates:
Most Common Value Estimate = 3.55887
Collision Test Estimate = 1.32914
Markov Test Estimate = 0.862447
Compression Test Estimate = 0.578813
t-Tuple Test Estimate = 0.514167
Longest Reapeated(sic) Substring Test Estimate = 1.63063

Predictor estimates:
Multi Most Common in Window (MultiMCW) Test: 100% complete
	Correct: 83535
	P_avg (global): 0.0842531
	P_run (local): 0.0727539
Multi Most Common in Window (Multi MCW) Test = 3.56913
Lag Test: 100% complete
	Correct: 66787
	P_avg (global): 0.0674302
	P_run (local): 0.046875
Lag Prediction Test = 3.89046
MultiMMC Test: 100% complete
	Correct: 828
	P_avg (global): 0.000902095
	P_run (local): 0.000100136
Multi Markov Model with Counting (MultiMMC) Prediction Test = 10.1144
LZ78Y Test: 99% complete
	Correct: 19004
	P_avg (global): 0.0193561
	P_run (local): 0.046875
LZ78Y Prediction Test = 4.41504
Min Entropy: 0.514167
The tests assess the entropy at 1/5 th of the true entropy measure. Unfortunately as mentioned in the introduction, results deteriorate as we measure a normally distributed data set.
Normal, IID
From SP 800-90B §5.1 Permutation Testing, the definition of an non-IID/IID entropy source is made at a 0.1% confidence level. It is entirely plausible (but untypical) that an entropy source may be only slightly correlated. A source might be categorised as non-IID at a confidence level of 0.09%, and we would therefore expect the entropy measure to be very similar to one for an IID source. We would not expect a significant step change in entropy values between the two categories. To test this expectation, a synthetic normally distributed dataset with μ = 23.76, δ = 3.010 was created. These parameters form the best normal approximation to a single photo-sensor site in the Photonic Instrument’s webcam. The dataset was created as:-
import random
with open('/tmp/sensor/gauss', 'wb') as f:
    for i in range(1100000):
        value = round(random.gauss(23.76, 3.010))
        f.write(value.to_bytes(1, byteorder='big'))
and the test was run:-
Entropic statistic estimates:
Most Common Value Estimate = 2.91906
Collision Test Estimate = 1.30966
Markov Test Estimate = 2.9395
Compression Test Estimate = 0.53095
t-Tuple Test Estimate = 2.86337
Longest Reapeated(sic) Substring Test Estimate = 3.42193

Predictor estimates:
Multi Most Common in Window (MultiMCW) Test: 100% complete
	Correct: 128980
	P_avg (global): 0.129852
	P_run (local): 0.101318
Multi Most Common in Window (Multi MCW) Test = 2.94506
Lag Test: 100% complete
	Correct: 93269
	P_avg (global): 0.0940182
	P_run (local): 0.046875
Lag Prediction Test = 3.41092
MultiMMC Test: 100% complete
	Correct: 0
	P_avg (global): 0
	P_run (local): 4.76837e-07
Multi Markov Model with Counting (MultiMMC) Prediction Test = 21
LZ78Y Test: 99% complete
	Correct: 0
	P_avg (global): 0
	P_run (local): 4.76837e-07
LZ78Y Prediction Test = 21
Min Entropy: 0.53095
Technically rubbish; what is it with 21? The impossible MultiMMC (21 bits /byte) result doesn’t inspire confidence that any rigour has been applied to the software implementation. An ASSERT statement may have been appropriate in the MultiMMC code. The theoretically correct $H_{min}$ is defined by a IID Gaussian probability for an integer corresponding range of $p(23.5 ≤ x ≤ 24.5)$, giving p = 0.1315.
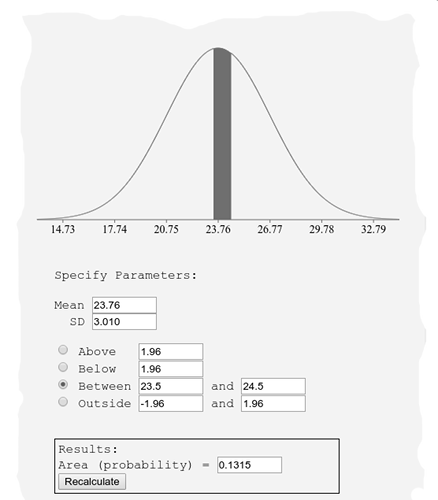
$p(x=24)$ within a normal distribution.
$H_{min}$ therefore = 2.92687 bits /sample or byte. This compares very favourably with min. entropy via a simple histogram for a most frequent value of $p(x = 24)$ as 0.131291, and thus is $\log_2(0.131291)$ or 2.92916 bits /sample.
Again comparing with a compression estimate via cmix, 1,100,000 bytes compresses to 501,936 bytes which is equivalent to a Shannon entropy of 3.650444 bits/byte. We would expect the Shannon entropy to be greater than the min. entropy value by definition in this case. The theoretical Shannon entropy is 3.644007 bits/byte based on Shannon’s sum log formula. cmix’s measure compares very favourably, being within 0.177% of the true theoretical value.
enwik8, non-IID
Out of interest, we also measured the entropy of the Hutter Prize test file enwik8 which has the following uncategorised frequency distribution:-
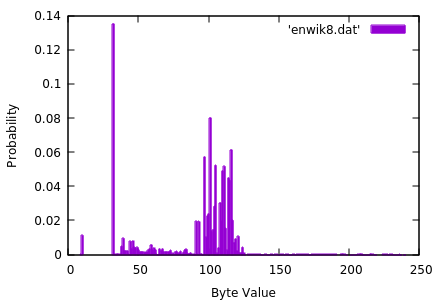
Probability distribution for file enwik8.
Entropic statistic estimates:
Most Common Value Estimate = 2.88848
Collision Test Estimate = 1.7352
Markov Test Estimate = 1.0772
Compression Test Estimate = 0.844013
t-Tuple Test Estimate = 0.0617628
Longest Reapeated(sic) Substring Test Estimate = 0.066801

Predictor estimates:
Multi Most Common in Window (MultiMCW) Test: 100% complete
	Correct: 134218
	P_avg (global): 0.135105
	P_run (local): 0.444824
Multi Most Common in Window (Multi MCW) Test = 1.16869
Lag Test: 100% complete
	Correct: 55584
	P_avg (global): 0.0561743
	P_run (local): 0.248047
Lag Prediction Test = 2.01132
MultiMMC Test: 100% complete
	Correct: 677
	P_avg (global): 0.000744004
	P_run (local): 0.161377
Multi Markov Model with Counting (MultiMMC) Prediction Test = 2.63149
LZ78Y Test: 99% complete
	Correct: 49321
	P_avg (global): 0.0498796
	P_run (local): 0.879517
LZ78Y Prediction Test = 0.185217
Min Entropy: 0.0617628
Clearly the Shannon entropy rate would be higher than the min. entropy, and this is difficult to estimate for all the reasons within this work. For fun, we extrapolate from the 90B value upwards to 0.1 bit /character. enwik8 would then be able to be compressed to approximately 1.25MB, or 1/12 th of the current Hutter Prize record. Unlikely. The current record equates to a Shannon entropy of 1.22280 bits/character. $H_{\infty}$ based on the space character being the most frequent is 2.88685 bits/byte.
Photonic JPEGS, non-IID
And finally, we use 90B to determine the entropy for the Photonic Instrument JPEGS:-
Entropic statistic estimates:
Most Common Value Estimate = 5.24509
Collision Test Estimate = 3.9098
Markov Test Estimate = 2.6879
Compression Test Estimate = 3.16011
t-Tuple Test Estimate = 0.0231577
Longest Reapeated(sic) Substring Test Estimate = 0.0458931

Predictor estimates:
Multi Most Common in Window (MultiMCW) Test: 100% complete
	Correct: 25832
	P_avg (global): 0.0262423
	P_run (local): 0.709229
Multi Most Common in Window (Multi MCW) Test = 0.495678
Lag Test: 100% complete
	Correct: 6051
	P_avg (global): 0.00625078
	P_run (local): 0.0252686
Lag Prediction Test = 5.30651
MultiMMC Test: 100% complete
	Correct: 1720
	P_avg (global): 0.00182675
	P_run (local): 0.624268
Multi Markov Model with Counting (MultiMMC) Prediction Test = 0.679764
LZ78Y Test: 99% complete
	Correct: 32135
	P_avg (global): 0.0325899
	P_run (local): 0.905029
LZ78Y Prediction Test = 0.143964
Min Entropy: 0.0231577
The most conservative Shannon entropy measurement we made using the compression technique was $H$ = 1 bit/byte. 43 times higher. Simple intuition tells us that the 90B measure is highly improbable. The bulk of any JPEG file is Huffman encoded data with a tendency to appear totally random. It’s the very nature of a JPEG.
Summary
In summary, it can be clearly seen that the 90B tests only approach true entropy values for uniformly distributed data (in the first row below) where the 90B measures are similar to that obtained by strong compression, and to the absolute theoretical Shannon value. Unfortunately for us here, the maximum error occurs when measuring the Photonic JPEGs which have a very peculiar probability distribution. 90B estimated only 1/215 of our uncorrected compressive value and 1/43 rd of our most conservative value.
| Distribution | IID | 90B | H Compressive | H Shannon | Hmin Theoretical+ |
|---|---|---|---|---|---|
| Uniform | No | 0.50258 | 0.58255 | 0.58048 | 4.31709 |
| Near Uniform | No | 0.51417 | 2.77107 | 2.76827 | 3.57058 |
| Normal | Yes | 0.53095 | 3.65044 | 3.64400 | 2.92686 |
| enwik8 | No | 0.06176 | 1.22280 | ? | 2.88685 |
| Photonic JPEGs | No | 0.02316 | 4.94411 | ? | 5.27101 |
+$H_{min}$ Theoretical is based on an 8 bit window, excluding correlations. It’s what ent does and is included for comparison/fun only.
And as a summary of the summary, the following graph illustrates the massive under estimation of non-IID entropy that 90B tests produce:-
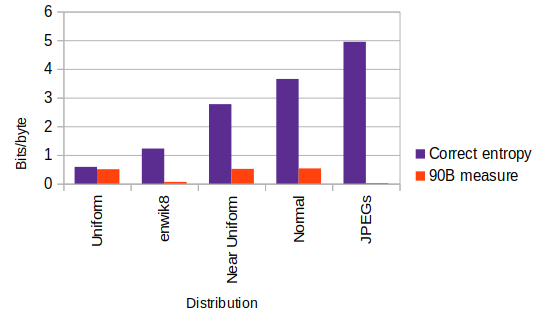
Correct and 90B measured entropy with varying distributions.
There is also reason to suspect the robustness of the IID assessment test code. The following is a test result from a sample that appears to fail an IID null hypothesis. numIncreasesDecreases fails all 10,000 tests runs, but the compression and covariance tests seem to safely pass. Yet covariance and compression metrics are theoretically closely linked to the number of increases or decreases between consecutive sample values. The induced bias of such ‘structures’ is exploited by compression algorithms, and we would expect this to be reflected in the covariance and compression test scores.
                statistic  C[i][0]  C[i][1]  C[i][2]
----------------------------------------------------
                excursion       6       0      39
       numDirectionalRuns     551       0       6
       lenDirectionalRuns       3       6       0
   numIncreasesDecreases*       0       0   10000   <====
            numRunsMedian    7516       0       6
            lenRunsMedian      46       6       0
             avgCollision       6       0      14
             maxCollision      10       4       2
           periodicity(1)     234       0       6
           periodicity(2)       6       0       6
           periodicity(8)      16       0       6
          periodicity(16)     118       0       6
          periodicity(32)      11       0       6
            covariance(1)       6       0     252
            covariance(2)     939       0       6
            covariance(8)      71       0       6
           covariance(16)     269       0       6
           covariance(32)       6       0      35
              compression       6       0       6
(* denotes failed test)

** Failed IID permutation tests
We can only conclude as others have done, that for raw real world entropy sources, the NIST 90B tests are…
Postscriptum
Perhaps the authors may have revised 90B to be more appropriate to the real world had they tested with non-IID data. They would then have seen for themselves that these tests are useless. https://github.com/usnistgov/SP800-90B_EntropyAssessment/tree/master/bin is the test data set the authors provide for validation. It’s entirely IID.
NIST have now accepted that their models very unfairly penalise non uniform distributions in a recent random bit generation workshop, Day 1, Part 2. (Kerry McKay speaking).