Quality assurance
$\alpha$ /p validation
You can see the efficacy of ent3000 below. Having tested 25,000 cryptographically random sequences, 5% failed on average. Exactly as per expectation with $\alpha = 0.05$.
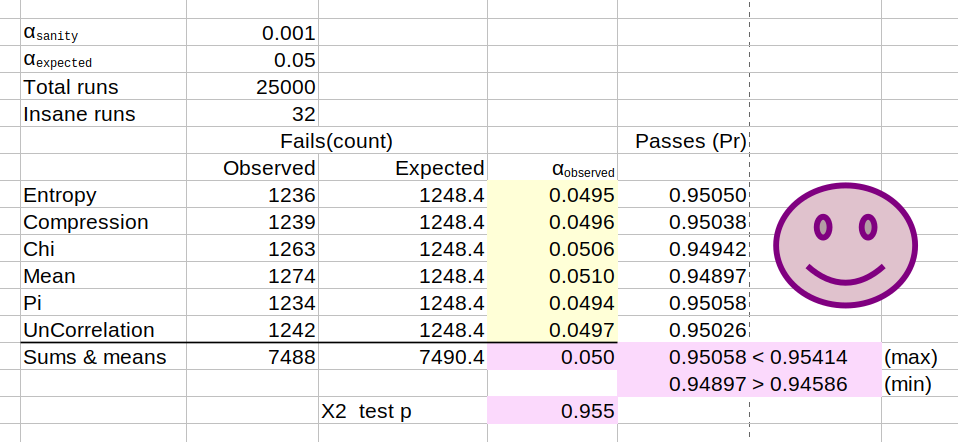
Observed critical value $(\alpha_{observed})$ following QA test.
The final $\chi^2$ p value calculation of 0.955 assumes independent categories for the QA test. See next section to for confirmation of this. However we have confidence in the $\alpha_{observed}$ statistic averaging out at 0.050. We believe this metric to be agnostic to covariance between categories.
Inter-test correlation?
Or, do the following p values relate to each other in some way?
       Entropy  Compression    Chi   Mean     Pi  UnCorrelation
0        0.366        0.354  0.563  0.671  0.975          0.034
1        0.285        0.180  0.134  0.707  0.785          0.334
2        0.084        0.094  0.668  0.631  0.833          0.069
3        0.207        0.206  0.745  0.716  0.012          0.255
4        0.926        0.524  0.897  0.658  0.486          0.853
...        ...          ...    ...    ...    ...            ...
24961    0.485        0.259  0.159  0.320  0.168          0.244
24962    0.422        0.128  0.877  0.800  0.314          0.255
24963    0.009        0.054  0.416  0.804  0.362          0.985
24964    0.566        0.446  0.878  0.369  0.635          0.005
24965    0.321        0.108  0.085  0.030  0.023          0.511

[24966 rows x 6 columns]
Analysis yields a covariance matrix as:-
                Entropy  Compression       Chi      Mean        Pi  UnCorrelation
Entropy        1.000000     0.052212  0.022306  0.044259  0.013491       0.004267
Compression    0.052212     1.000000 -0.001202 -0.003658 -0.007357      -0.003800
Chi            0.022306    -0.001202  1.000000 -0.004337  0.011061       0.006199
Mean           0.044259    -0.003658 -0.004337  1.000000  0.136555      -0.002745
Pi             0.013491    -0.007357  0.011061  0.136555  1.000000       0.007851
UnCorrelation  0.004267    -0.003800  0.006199 -0.002745  0.007851       1.000000
A maximum covariance of 0.137 ties together Mean and Pi tests, and a covariance of 0.052 relates Compression and Entropy tests. Those values are statistically significant given a critical value ($\alpha$) of 0.05 indicating redundancy and reduction in test coverage, yet we keep the tests as they are extant in ent. After a bit of seaborn pandas, we get the following heatmap:-
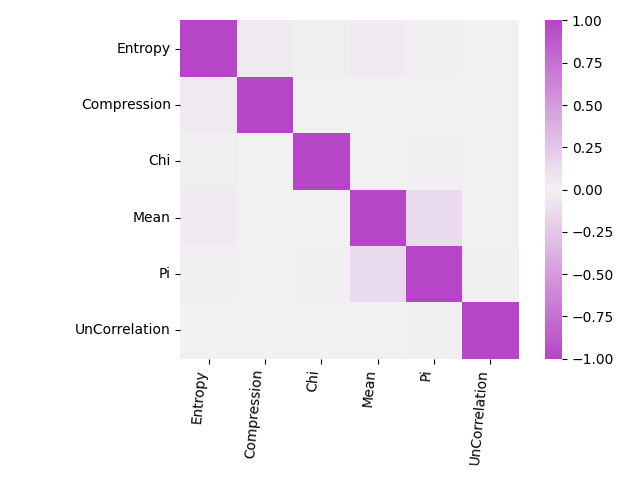
Inter-test correlations.
These data are available for download below.
p value distribution
The distribution of p values was examined to ensure uniformity. This may be visually illustrated using a histogram (as below), whereby the interval between 0 and 1 is divided into 10 sub-intervals, and the P-values that lie within each sub-interval are counted and displayed. Then for 24,966 sane and not OoC trials, we get:-
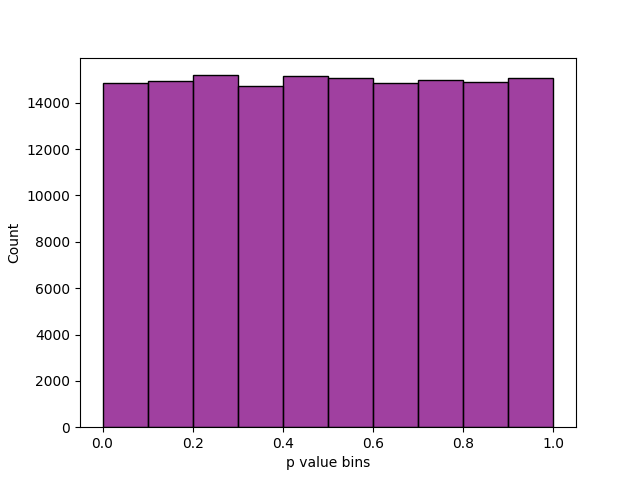
Distribution of all tests' p values for QA run.
Uniformity may also be determined via application of a $\chi^2$ test and the determination of a p value corresponding to the goodness of fit distributional test on the p values obtained during the QA run (i.e. a p value of the p values). But we won’t bother. Just look at the histogram ↑. Rad. However, we did achieve p = 0.709 from a Kolmogorov-Smirnov test for uniformity over all the individual p values. This also speaks to the general independence of the tests.
Does ent3000 work then?
We can also assess the proportion of sequences passing any individual test. The number should be bounded as $\hat{p} \pm 3 \sqrt{\frac{\hat{p}(1-\hat{p})}{n}} $, where $\hat{p}=1-\alpha$ with $\alpha=0.05$, and $n$ is the QA run trails size (25,000 - 32 - 2)/test type. This gives us a confidence interval of $0.95 \pm 0.00414$ on the proportion (Pr) of which the passing tests should lie. That’s Pr = 0.94586 through 0.95414. You can see in the spreadsheet up top that they do.
Therefore it works 🙂